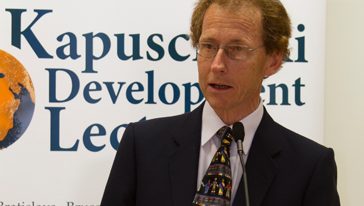
In the beginning of the lecture, Jan Vandemoortele suggested the reading of Emperor, written by Ryszard Kapuscinski, and Thomas Kida’s book with the provocative title Don´t Believe Everything You Think: The 6 Basic Mistakes We Make in Thinking, because he argues that one of the mistakes that people commonly commits is to seek confirmation, not to question, their ideas.
Starting on a positive note, and to make sure that we would keep the eyes on the big picture, Vandemoortele emphasized how the world has been making human development progress:
- 000 fewer under-5 deaths every day;- 40 million fewer children out-of-school;
- Polio cases: from 35,000 to less than 1,000;
- Malaria deaths down by 20%;
- New HIV infections down by 25%,
- 13-fold increase in antiretroviral therapy since 2004.
Actually, since 1990, the percentage of children underweight felt from 30% to 23%, which means -7%. The rate of primary school enrolment increased from 82% to 89% (+7%); and the percentage of girls in primary school grew 9%, almost achieving parity. The child mortality went from 10% to 7%. Measles immunisation went up 11%, and babies deliveries (doctors, nurses, midwifes, etc.) went up 10%; which means that now two in three births in developing countries are assisted by qualified health personnel.
The world is making progress and is now a better place today than it was 20 years ago. The question is: it is enough to meet the promise that we made for the Millennium Development Goals by 2015?, asked Vandemoortele.
If we look to global MDG scorecard of the 5 key indicators that demonstrate the goals which have been achieved from 1990 to 2009, we only get close to it in one of the indicators – gender parity, which is the percentage of girls going to primary school. It’s good, but that does mean that only gender discrimination is about to be eradicated from the world. And when you look to the other areas, as health and education, we are no way near achieving the MDG; we are going to miss those goals. And the conventional narrative is that Africa is the main cause why the world is not going to achieve the MDG. That’s the common statement, that’s written in many reports, including in reports of UN.
If we look to global trends, the argument is that we will miss the targets due to the performance in Africa. But if we only look to African data, we realise that it’s not true. If we pick up in the underweight indicator, it fells in Africa around 5%, while in global terms down 7%. But if we look to primary school indicator, it increased in Africa 18%, much more than 7% of the world together. The percentage of girls going to school in Africa up 13%, more than 9% in global terms. Child mortality around -5%, against -3% of rest of the world. Measles down 13%, better than the 11% globally. The indicator that Africa is missing out is in maternal deliveries that only increased 4%, less than 10% elsewhere. In the basis of these evidences, we see that Africa is making its fair contribution to global progress, to achieve the MDGs. Africa will not meet the MDGs by 2015 because it started from a low level and the bar is to high to jump. But it made a fair contribution to progress globally.
When we look at Blair’s Commission for Africa’s report (2005), it was written “African poverty and stagnation is the greatest tragedy of our time”. Stagnation? If we look to numbers, that’s not stagnation, there is a respectable progress. This report is an example that we seek to confirm our ideas, rather than to question.
Jan Vandemoortele used the MDG under five mortality rate (U5MR) that he considers one of the most solid indicators to demonstrate changes in global and relative terms. Using data from 192 countries we see that most of the countries suffered a decreasing in U5MR, except countries as Zambia, South Africa, Tuvalu, Haiti, where VIH predominates. But, for instance, Niger reduced almost a half; Mali was down from 250 (1990) to less than 200 (2008), which it means a major achievement. Belgium reduced from 10 to 5, which represents a cut of 5.
If we look to the same data, the same sample, but in relative terms, which means that we look to the percentage change, the point of view changes radically. The countries that initially have a high level of mortality saw relatively small changes in the indicators.
There are two ways to presenting the data – from an absolute angle or a relative angle. Both are valid. Actually, they are complementing, because we look at the same reality in different angles. But the MDGs were mostly formulated in percentage changes, because it’s always measured in relative terms. Countries that started from a low level of human development have a hard task to reach the MDGs. Even for developed countries will be difficult, because they are so close to zero that it’s difficult to go further. It’s a big deal, and that is a part of reality that is missing in the statistics. The storyline since 1990 is that progress has continued, but at a slower pace than in the 70s or the 80s. In all the human development dimensions, progress has slowed since 1990. And most of the progress that we made has bypassed the poorest and the weakest.
We have to be careful about statistics. All indicators are imperfect, but some are more imperfect than others. Statistics are based in two activities: the first is to observe, and the second one is to take that information and to make a transformation out of it. And it’s very difficult to measure some indicators from direct observation.
For Vandemoortele, the most reliable 5 indicators, because they depend on observation, are:
- under-five mortality rate;
- underweight among children;
- net enrolment ratio in primary education;
- ratio of girls to boys in primary & secondary school;
- proportion of births attended by skilled health personnel.
They are not perfect, but they are closer to reality. The other extreme, are the 5 indicators that involve heavy transformation, and that are more questionable, and unfortunately are the indicators most quoted in the literature:
- proportion of population below $1 per day (often used by World Bank);
- proportion of population below a minimum level of dietary energy consumption (FAO statistic, it’s produced and only used in Rome; it’s based in assumptions);
- primary school completion rate (much better that dietary energy consumption, but it’s hard to associate the people that complete primary education with the core heart that start primary education);
- maternal mortality ratio (very poor indicator, never used);
- proportion of population with access to safe drinking water (often used by UN).
These indicators are very problematic indicators.
The conventional wisdom sometimes uses the statistics to make ideology look as empirical evidence. The conventional narrative is the 3Gs: we need growth, grants and better governance. And if we got it, we will achieve the MDGs. The narrative cannot be so simplistic. They need a bit of sophisticated approach to it. For instance, good governance: in the 80s, Congo had the dictator Mobutu, who wasn’t a good example of governance. But a professor in Cambridge takes another angle and suggested to look to another country at the same time, where was another dictator, as Suharto in Indonesia. The results were very different.
In the 16th century, there was Mughal Shah Jahan, a ruler of an empire in South Asia, who was married and had 14 children. His wife died in 14th childbirth and he built Taj Mahal as tribute. A few years later, Queen Ulrika-Eleonora was a queen that saw many of the women around her died in childbirth. So she established in 1685, in Stockholm, the first-known school for midwifery. It’s an example of two leaders facing the same problem, but with very different approaches to it.
Development is always a collective journey of self-discovery, for poor or rich countries. The conventional narrative is always ready to give the roadmap, to tell how to get there. But it is important to reframe and to have lessons learnt. We often make the mistake of equating the validity of a lesson learned with the level of replicability of that lesson. But it’s a big mistake because the contexts, the actors are different, even if the problem is the same.
The inconvenient evidences are climate change, inequalities and the global trading system. Those three things create real jeopardy for the future. We need growth, we need more aid, and further better aid, and good governance. But we need much more than that. And if we are not ready to face those three, especially inequalities, we are not going to get there.


